Tools
Story Ansible
Story Ansible is a project that uses Ansible to automate the deployment of Story nodes.
GitHubKey Features
- Automated deployment of Story nodes
- Support for default pruned nodes and archive nodes
- Customizable ports
- Option to expose endpoints
Usage
-
Clone the repository:
git clone https://github.com/silentnoname/story-ansible
cd story-ansible -
Configuration: Copy and edit the
inventory.inifile to set server information and node type. -
Run: For default nodes:
ansible-playbook main.yml -e "target=story story_geth_snapshot_url=<Story geth snapshot> story_snapshot_url=<Story snapshot>"For archive nodes:
ansible-playbook main.yml -e "target=story story_archive_snapshot_url=<Story archive snapshot> story_geth_snapshot_url=<Story geth snapshot>"
For more details, visit the Story Ansible GitHub repository.
Story Grafana Dashboard
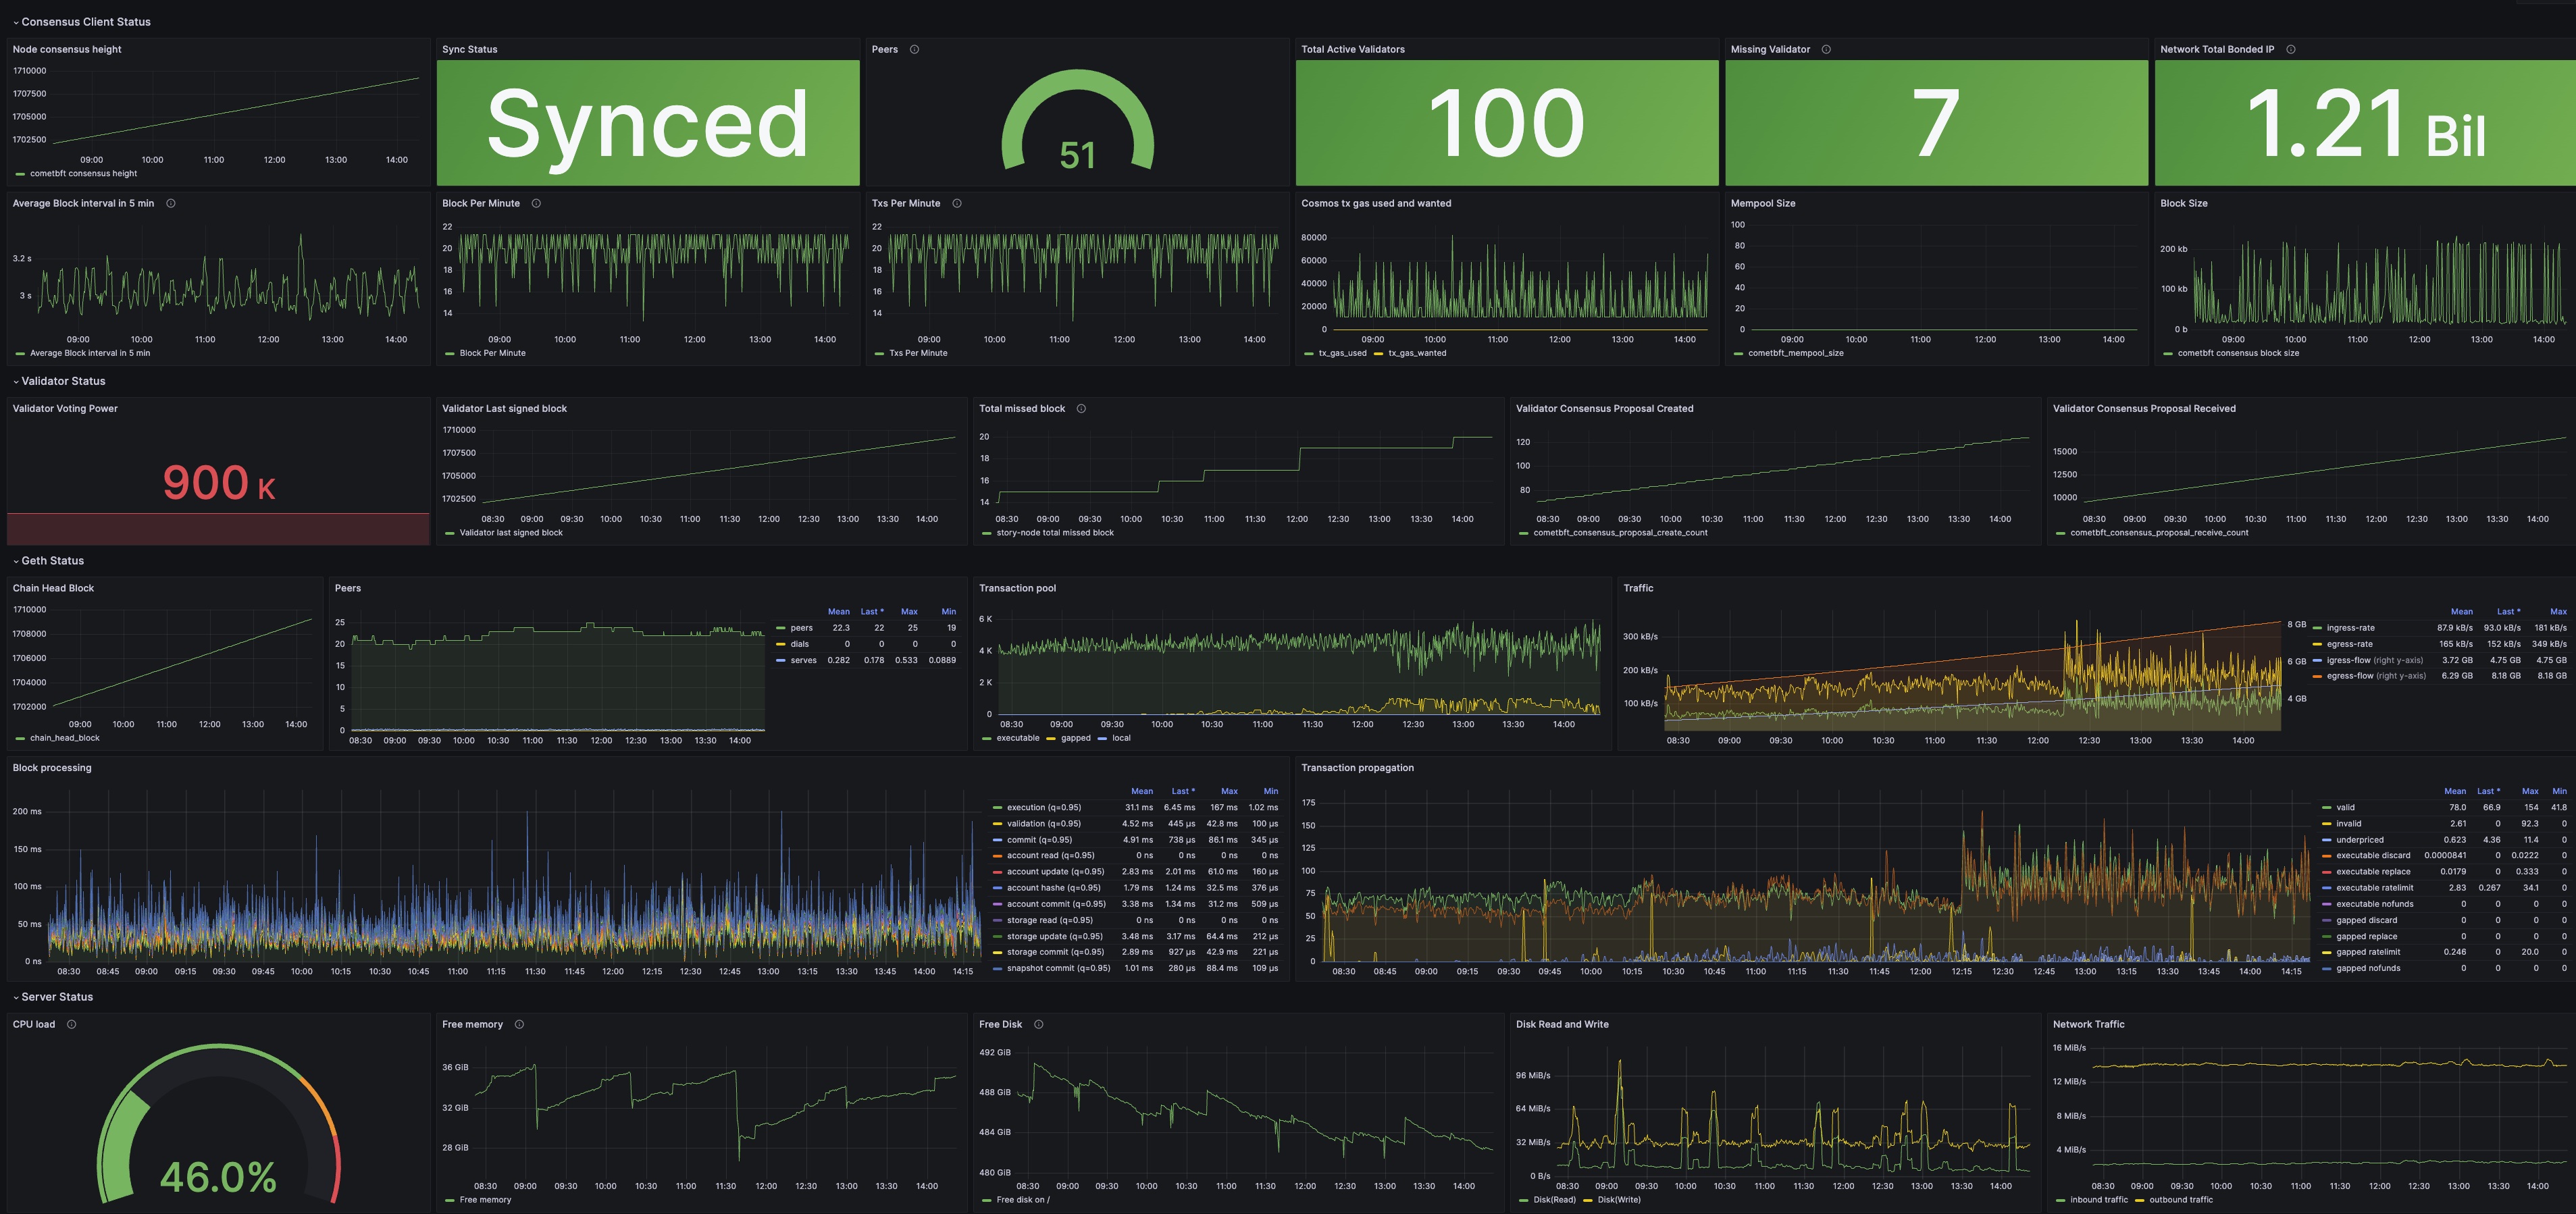
Story Grafana Dashboard is a monitoring tool for the Story blockchain created by silent validator.
GitHubDashboard Preview

Key Features
- Monitors Story consensus client status
- Tracks validator status
- Displays geth status
- Shows server status
Usage
- Enable Prometheus metrics on Story consensus client and Story Geth.
- Install and run Node Exporter.
- Configure Prometheus to scrape metrics from your nodes.
- Import the JSON file into Grafana and set up the data source.
For detailed setup instructions, visit the GitHub repository.