Story Grafana Dashboard
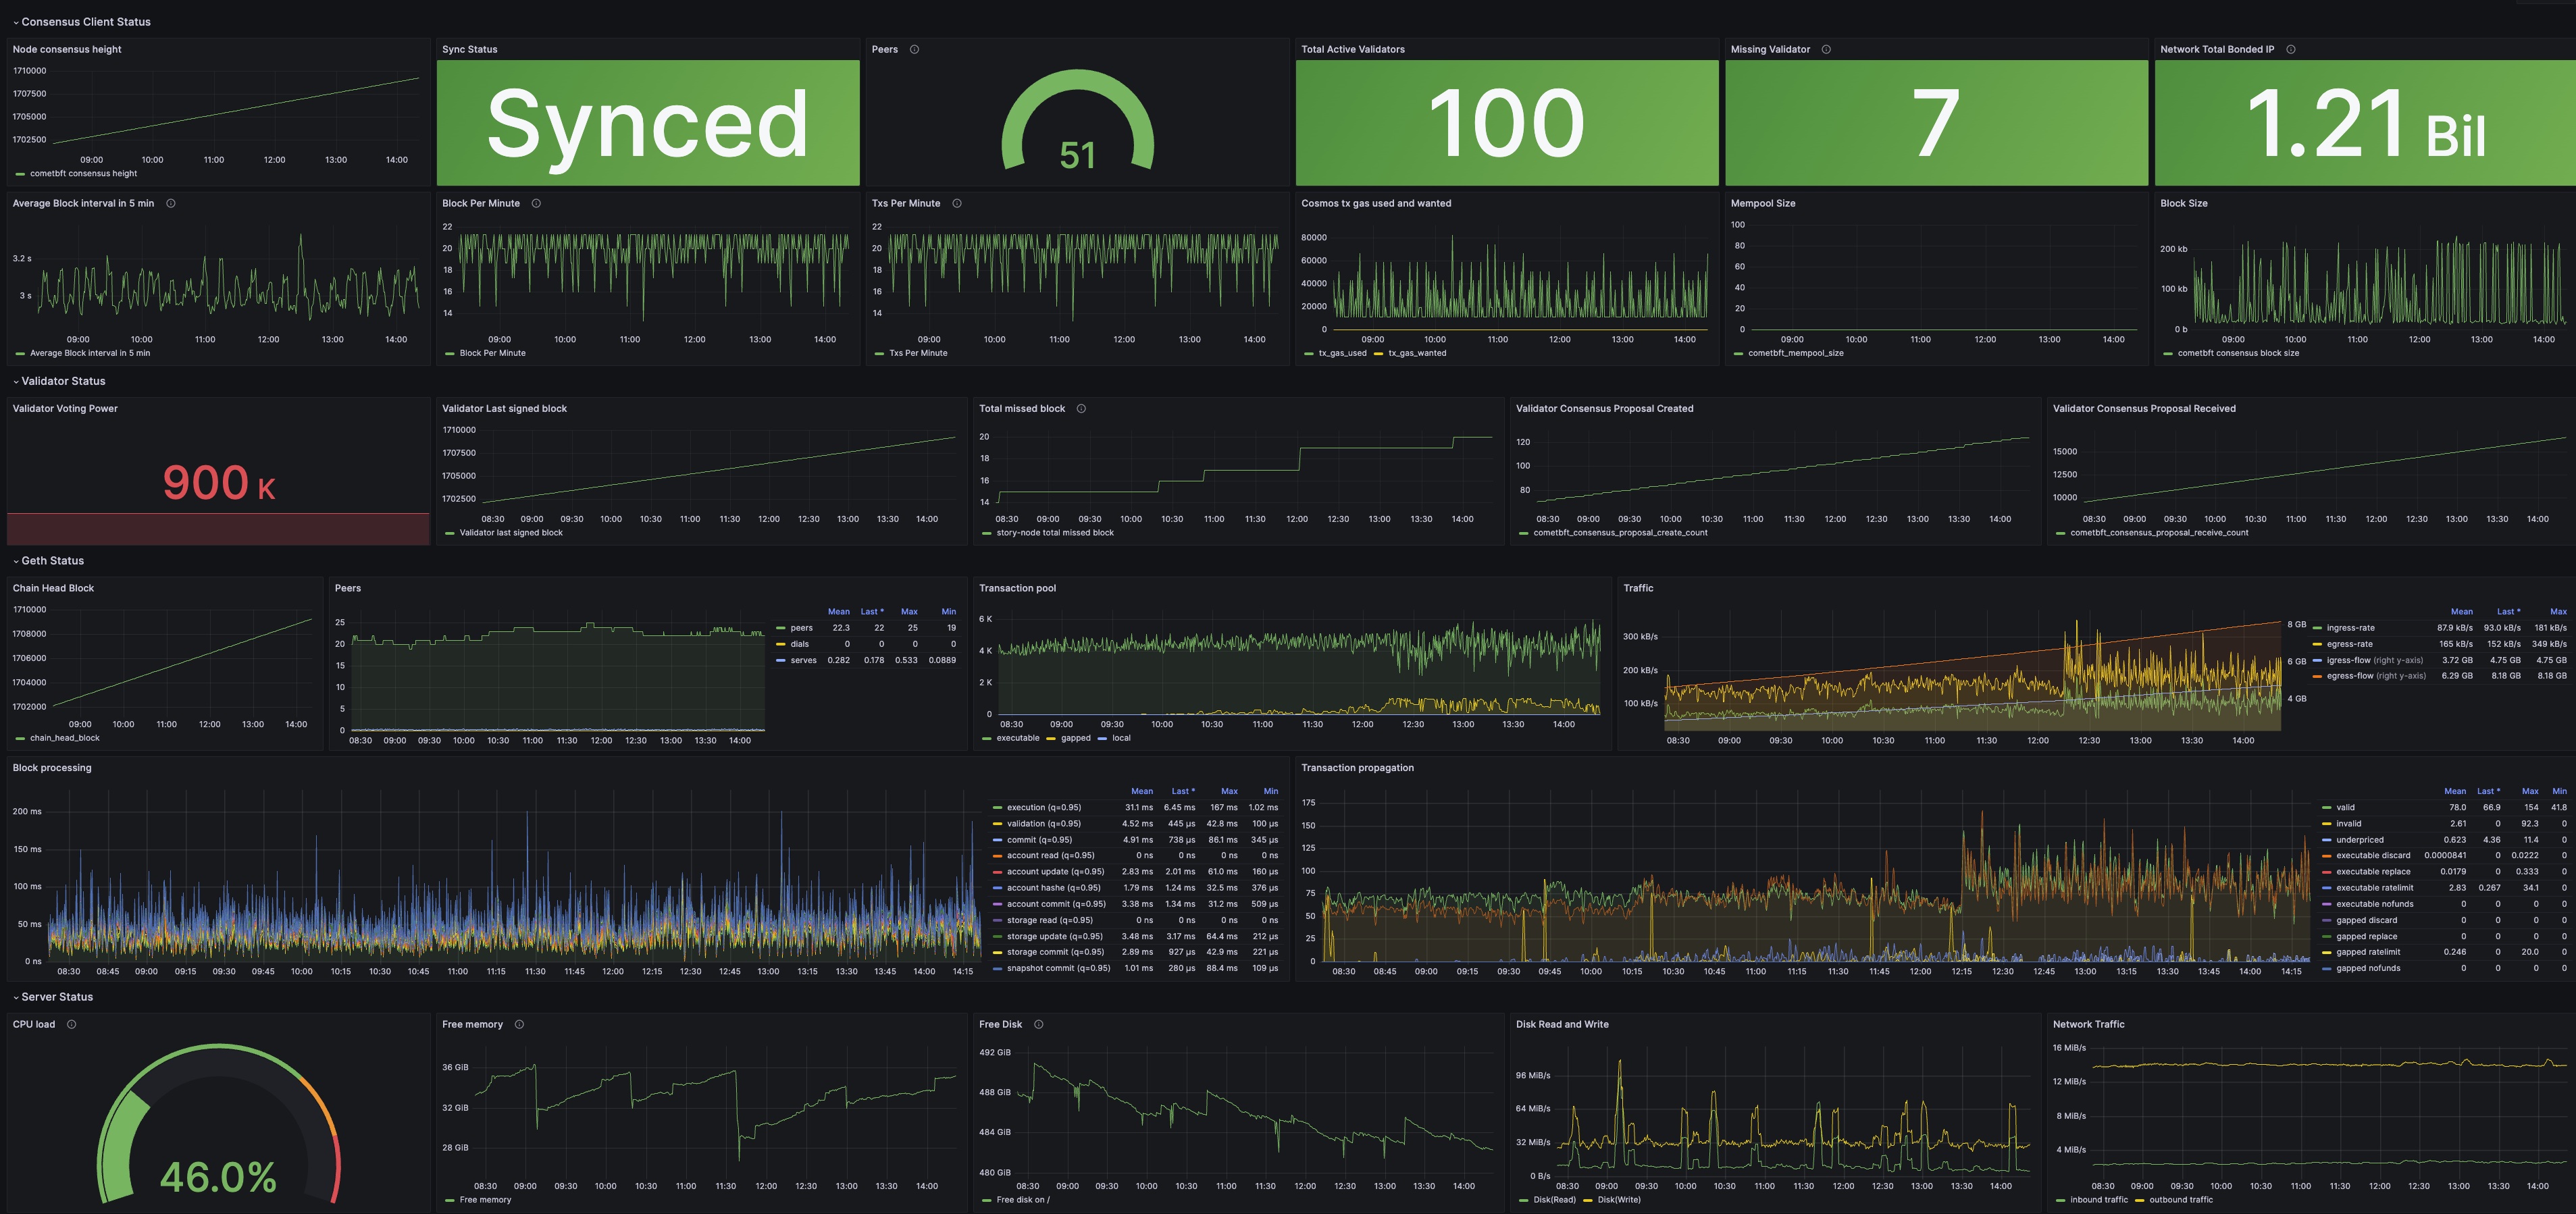
Story Grafana Dashboard is a Grafana dashboard for the Story blockchain created by silent validator. It includes Story consensus client status, validator status, geth status, and server status.
Dashboard Preview

Usage
To use this dashboard, you need to enable Prometheus metrics on your Story consensus client and Story Geth, and open the corresponding ports.
1. Story Consensus Client Setup
Enable Prometheus metrics in your Story consensus client config file config.toml:
sed -i "s/prometheus = false/prometheus = true/g" $HOME/.story/story/config/config.toml
The default port is 26660.
2. Story Geth Node Setup
Enable Prometheus metrics by adding the metrics flag to your geth execution. For example:
geth --iliad --syncmode full --http --ws --metrics --metrics.addr 0.0.0.0 --metrics.port 6060
Restart your node for the changes to take effect.
3. Install and Run Node Exporter
Install and run Node Exporter to expose your server status metrics:
- Download and install Node Exporter from the official GitHub repository.
- Run Node Exporter as a background service.
- Ensure it's accessible on the default port 9100.
For detailed installation instructions, refer to the Node Exporter documentation.
4. Prometheus Setup
Add the following to your prometheus.yml:
  - job_name: "story-nodeexporter"
    static_configs:
      - targets: ["<YOUR_IP>:9100"]
        labels:
          label: "story-node"
  - job_name: "story-metrics"
    static_configs:
      - targets: ["<YOUR_IP>:26660"]
        labels:
          label: "story-node"
  - job_name: "story-geth"
    metrics_path: /debug/metrics/prometheus
    static_configs:
      - targets: ["<YOUR_IP>:6060"]
        labels:
          label: "story-node"
5. Grafana Setup
- Import the JSON file in your Grafana.
- Use your Prometheus as the data source.